Why is the US stock market rallying? This article explains why the Us stock market is rallying and gives a scope as to what the future may hold for some of the major US indices.

Welcome to Simply Economics. This article is part of a series that provides an in-depth analysis of the stock market for readers with strong economic knowledge. Click here for more articles in this series.
WHY IS THE US STOCK MARKET RALLYING?
Since the last article, the S&P 500 has rallied almost 10%. The disparity between the economic outlook and the stock market sentiment may cause confusion. However, there is good reason as to why the stock market may be rallying even though the future of the US economy looks bleak, to say the least.
The main reason why stock markets not only in the US but globally, are rising is because of the fiscal and monetary stimulus many governments are providing. For example, in the US alone, there are 6 major stimulus programs which are worth a total of around $11 trillion!
As the old saying goes, do not fight the Fed. Jerome Powell is running an $8 trillion balance sheet and its these massive injections of money into the US economy which is providing the major US indices with support and confidence, allowing them to rally.
WHAT ARE THE RISKS OF ‘PRINTING’ THIS MUCH MONEY?
This immense printing of money does not come without risks. It can create financial bubbles caused by an excess of easy money in the economic system. These bubbles can easily burst with painful effects on the economy.
Furthermore, the increase in the money supply can cause inflation which reduces the purchasing power supply of the US Dollar which is bad news for the savers and lower-income households.
IS THE MARKET GOING TO CONTINUE TO RALLY?
Although it is extremely hard to predict the stock market on any time scale, there are indicators which point us in the direction as to where the stock market could be heading next.
While technical analysis tools such as oscillators and indicators like the RSI (currently at 55 on the S&P 500) shows us that there is still more steam in the current rally, fundamental analysis shows us that, in the long run, the future is not as simple.
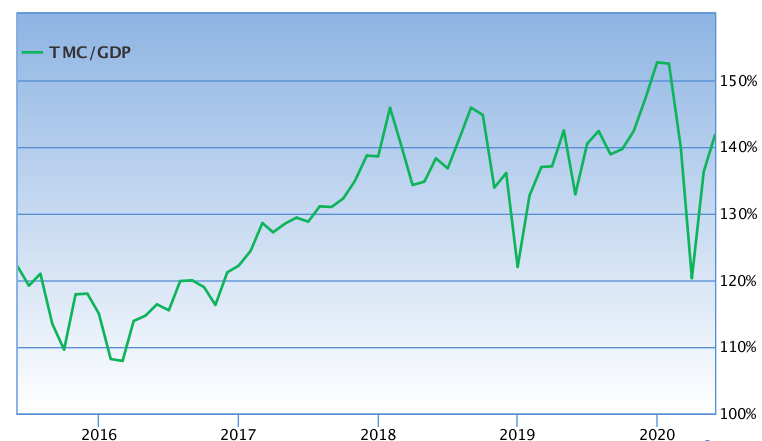
Below is a chart known as the Buffet Indicator, a ratio between the total market capitalization and the gross domestic product of the USA. It is an indicator described by Warren Buffet as “probably the best single measure of where valuations stand at any given moment.”
Here is a table that explains the value of the ratio means:
| RATIO: TMC/USD | VALUATION |
| RATIO < 50% | Significantly Undervalued |
| 50% < RATIO < 75% | Modestly Undervalued |
| 75% < RATIO < 90% | Fair Value |
| 90% < RATIO < 115% | Modestly Overvalued |
| RATIO > 115% | Significantly Overvalued |

As shown above, according to the Buffet Indicator, the stock market is still significantly overvalued. In fact, it is higher currently than it was at the peak of the 2008 housing bubble and the 2000 tech bubble. This indicates that the market may crash again, but this time, harder. Over the long run, the TMC/GDP tends to head towards it mean which is around 80%.
Therefore, it is best to hold cash as ‘those who hold cash during a recession is a king’. However, the timing of the crash is unknown and incredibly hard to predict. Although one can use technical indicators to gain an insight as to when the market may collapse, no one can truly predict the precise moment when it will all come tumbling down.
In conclusion, the major US indices continue to climb upward due to the influence of the Fed pumping an immense amount of money into the economy and there is still room for them to rally more. However, fundamental analysis shows us that the stock market is still significantly overvalued. This shows us that another stock market crash may be on its way.
Ultimately, no one can predict the stock market with 100% certainty and the range of probabilities in the stock market is still extraordinarily wide which makes even more difficult for analysts to predict what is going to happen next.
Feel free to ask any questions and sign up below for the latest updates. Click here for more articles. For more articles in the Stock Market Analysis series, click here.
2. Production Possibility Frontiers (PPF).
What are production possibility frontiers? This article explains what PPFs are and what causes movements…
5. Demand Theory
Demand theory. This article explains what the demand theory is and will go on to…
Why the Stock Market is Going to Crash.
Why is the stock market going to crash? Since the crash in March, markets across…

Thanks for sharing. I read many of your blog posts, cool, your blog is very good.


Your article helped me a lot, is there any more related content? Thanks!


Thank you for your sharing. I am worried that I lack creative ideas. It is your article that makes me…


Thanks for sharing. I read many of your blog posts, cool, your blog is very good.


Thanks for sharing. I read many of your blog posts, cool, your blog is very good.
WHY IS THE US STOCK MARKET RALLYING?WHY IS THE US STOCK MARKET RALLYING? WHY IS THE US STOCK MARKET RALLYING? WHY IS THE US STOCK MARKET RALLYING? WHY IS THE US STOCK MARKET RALLYING? WHY IS THE US STOCK MARKET RALLYING? WHY IS THE US STOCK MARKET RALLYING? WHY IS THE US STOCK MARKET RALLYING?


Thanks for sharing. I read many of your blog posts, cool, your blog is very good.
Your article helped me a lot, is there any more related content? Thanks!
Your article helped me a lot, is there any more related content? Thanks!